1. Monitoring asset health with the help of artificial intelligence
The largest power transmission line in the world is located in Belo Monte-Rio, Brazil, and accounts for 2,543km-long. Whereas the tallest transmission tower ever built is 370 metres high and can be admired at Mount Damaoshan in China. Impressive, right? Now try to picture these gigantic assets, spread throughout an immensity of kilometres, aged by time, exposed to extreme weather conditions, hugged by growing vegetation, and visited by storks who find them as attractive as a flat in the city center. It is very likely that defects and missing inventory start to pop up. (Figure 1)
Regular inspections and monitoring asset health is key to avoid serious consequences, like power outages and wildfires. Either using helicopters, smartphones or drone cameras, transmission system operators (TSOs) periodically collect thousands and thousands of images of their towers for posterior analysis. This allows network managers to compare the state of the infrastructures over the years and make decisions concerning budget and maintenance. But the fact is that managing such large amounts of data results in one of the biggest pain points in the industry.
3,000km of transmission towers usually generate about 1 million photos. In France alone, there are more than 100,000km of high voltage lines. Can you imagine manually storing, sorting and going individually through the millions of pictures taken during inspections to spot problems that can be only a few millimetres wide? It is an extremely exhaustive and time-consuming process.
To fight this productivity bottleneck, artificial intelligence (AI) is a very convenient technology, which helps accelerate inspection data analysis. This software solution automatically highlights defects and equipment on inspection pictures and enables business domain experts to deliver faster and better asset health reporting. (Figure 2)
Over the following pages, you will learn how AI can transcend the industry heterogeneity and be quickly deployed within complex corporate workflows. More precisely, we will take you through Sterblue’s journey to solve a real data challenge proposed by one of the largest TSOs in Northern Europe.
2. Challenge Accepted: Training, testing and deploying Sterblue AI in only 4 days
To foster the adoption of artificial intelligence inside big corporations, the advantages of this tool need to be clearly demonstrated. Energy and utility companies want to make sure the solution can match their needs and that there is a real return on the investment. A good option to do so is to launch an AI proof of concept (PoC) to evaluate potential business partners. This way, companies can get educated, test and promote internally the value of AI, by showing real results to relevant stakeholders.
In July 2020, a TSO responsible for more than 40,000km circuit kilometres of transmission lines in Europe initiated a data challenge to test multiple vendors on their artificial intelligence capabilities. It goes without saying that Sterblue was immediately eager to participate. And these were the conditions:
- The training phase would be performed on 1,234 photos of transmission towers where 6 types of defects had to be detected.
- After that, the AI test would be run on a validation data set of 405 never seen images, in a maximum period of 24h.
- As a whole, the process had to be completed and the results delivered to the TSO in less than 2 weeks.
Since 2016, Sterblue has been accumulating experience with multiple customers worldwide and building dedicated artificial intelligence tools for different types of assets, including power grids. To maximize the synergies in the course of this project, we performed every step in Sterblue Cloud platform. (Figure 3)

“3 years ago, our first pilot projects on artificial intelligence with energy companies used to take between 6 to 8 weeks to be delivered. Today, we are able to do exactly the same but in only 4 days and even less by the end of 2020. These time-savings are highly valuable not only for Sterblue, but most importantly, for our customers. And this project was the perfect opportunity to show it!” Geoffrey Vancassel, Sterblue CEO
3. Preparation: Looking at the heterogeneity of the data set
Capturing good data plays a major role in the expected results of the AI. For the past 4 years, Sterblue has been promoting a vision where data is automatically collected using off-the-shelf drones powered by an automatic navigation software. Nonetheless it will take time to shift to this standardized approach, since traditional inspection methods are still rooted in big corporations. Lack of information, investment priorities and switching costs are some of the reasons why. (Figure 4)
The major European TSO was making use of multiple processes, employees and sources of imagery (smartphones, helicopters, drones) to perform the inspections. This poor standardization and high variability led to a very disparate data set. Generally speaking, the quality of the data lake was a challenging aspect of this project because:
- Among the 1237 images provided, only 44 (3.6%) met Sterblue’s quality standards (Figure 5).
- The file formats (.jpg, .png, etc.), zoom percentages and sizes of the images were very heterogeneous.
- There were many different transmission towers featured in the pictures, with variable surrounding environments.

After having a clear view on the complexity of the test, Sterblue uploaded the 1237 images on Sterblue Cloud, using the Smart Uploader. This feature allows not only to scale mass uploads of different formats (+100GB in photos at a time), but also to allocate each picture to the corresponding infrastructure and associated equipment. It is designed to anticipate possible human errors, tackle problems before they can create any issues and ensure the most structured database. Thanks to that, Sterblue was able to spot and eliminate two duplicates on the provided data, ending up with 1235 originals.
On a regular analysis of inspection data, bad quality images are automatically and, if needed, manually filtered out in Sterblue Cloud. The goal is to make sure the system only ingests clean data. However, this challenge aimed to show the capabilities of each vendor when dealing with strong image heterogeneity. Thus, the 1237 images (actually 1235) were not going anywhere!
4. Labelling: Combining precise human expertise with AI
Different companies have different asset management policies. This variability can depend on many factors, like the country, type of tower, weather conditions or even internal specifications, such as the terminologies used to classify anomalies on infrastructures (defect referential). (Figure 6)
For this challenge, 6 standard types of labels were required: rusted insulator, broken insulator glass, polluted insulator, flashover insulators, rusted tower structure and bent tower structure.
Among the mentioned defects, Sterblue's dedicated AI tool for transmission towers was already trained to detect "rusted insulators" and "rusted tower structures", since these are some of most commonly asked by our customers. However, it had never been used on the particular towers of the major TSO or the 1237 pictures provided for this challenge. Therefore, a team of industry experts had the important task of manually labelling the entire data set, so that our model would learn how to automatically identify the 6 types of defects during the training phase. (Figure 7)
From a customer’s point of view, asking for specific referential may sound like a basic requirement. But for the vendors it raises a tricky question: how can we scale and capitalize on our existing AI models without having to start from scratch each and every time?
Disparities in the data set, different tower types and customer specifications can put the most elaborated algorithms to shame. A one-size-fits-all approach will not do. According to Hanna Kerner, for the MIT Technology Review, “machine-learning researchers who fail to realize this and expect tools to work “off-the-shelf” often wind up creating ineffective models.” To overcome this issue, Sterblue models each customer’s industrial reality in what we call the “Universal Anomaly Referential”. This way we can map detections with any available data on our base, making it unnecessary to start from scratch with a new customer, while accounting for different realities.
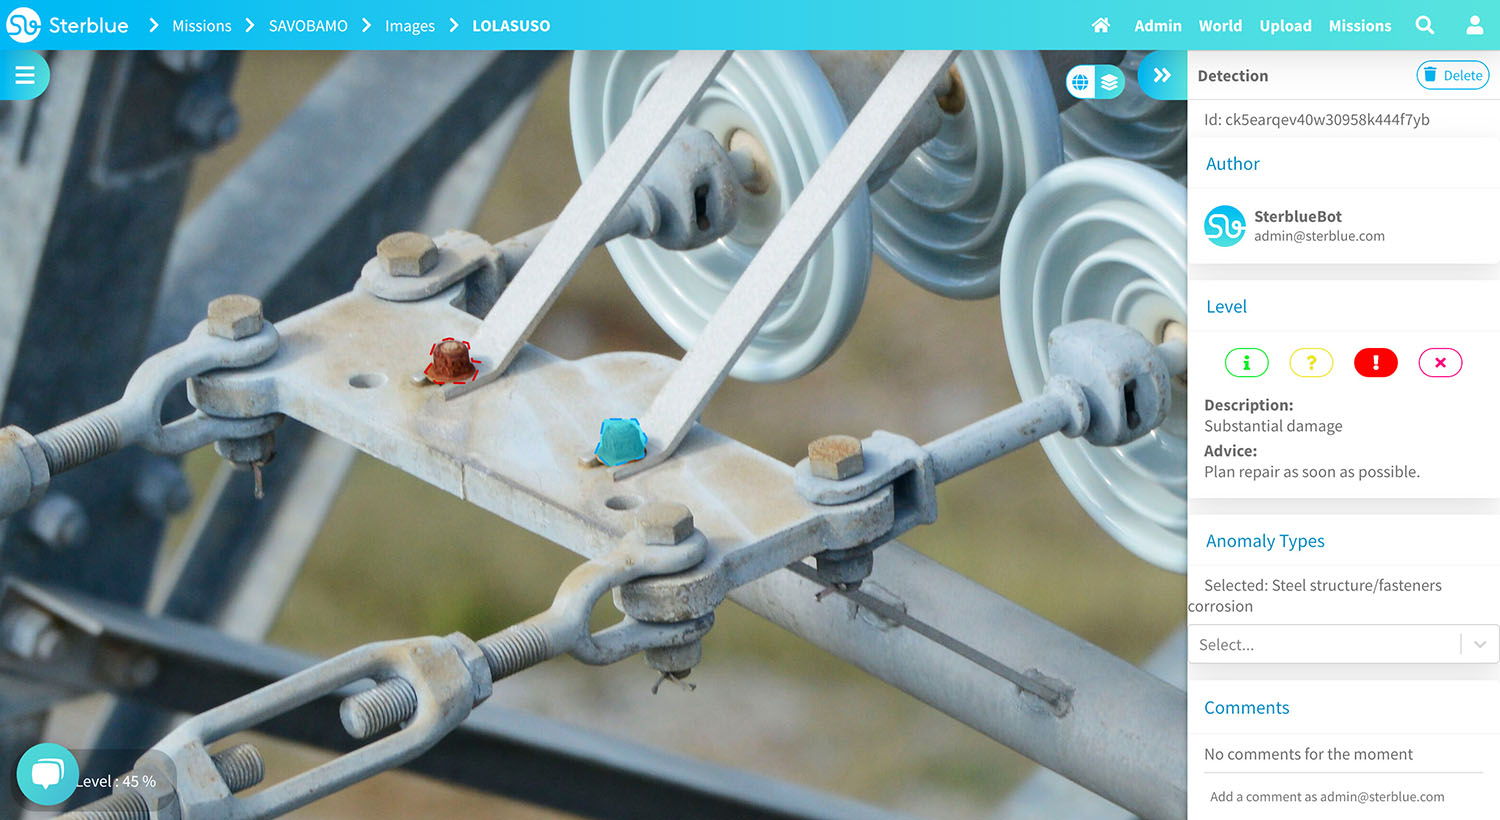
The last point to take into consideration was the labelling strategy required by the customer. In this case, the TSO only provided us with an excel sheet stating which anomalies were present on which images. Or, in other words, no labelling strategy at all. To fill in this gap, Sterblue decided to target the most precise and uniform labels for each of the 6 types of defect. The goal was to draft segmented annotations, with precise edges around the damaged parts, making sure there were no performance losses when adapting our algorithms. (Figure 8)
Before Sterblue's experts began to label the 1,234 pictures in Sterblue Cloud platform, we let our pre-existing AI for transmission grid analyse the data set and look for rusted tower structures and rusted insulators. Although our model had never seen these pictures or towers, it was still capable of automatically detecting 866 of the mentioned defects. This was an important help considering that corrosion spots were the most predominant detections. After that, our team of industry experts performed another 2,416 manual annotations. On average, 2.6 detections were added per image. (Figure 9)


5. Training: Tailoring the AI to the customer’s specifications
The following natural step was to train Sterblue’s dedicated neural network on the challenge data set. It takes several iterations for the model to learn how to interpret the characteristics of the image and adjust the possible decision paths until converging to the ideal one. To start, Sterblue did some fine tuning and optimization on the algorithm, minimizing the possibility of deviated predictions, or what is called a “loss function”. Then, the training was run on 90% of the images (randomly selected), leaving the other 10% for validation purposes. While this decision can slightly limit the training potential, it also enables Sterblue to better monitor and tune the model parameters.
As mentioned before, back in 2016, when Sterblue was founded, training our AI for a new customer used to be a slow and long process. Today, we could complete the labelling and training phases on the 1,234 images provided for this challenge in 4 days. The last and final stage of this project was to test our AI capabilities on the validation data set of 405 images, in which Sterblue took less than 1 hour (out of a 24h deadline). This was only possible thanks to our state of the art training system and the level of maturity achieved by our dedicated AI tools. (Figure 10)

“Sterblue’s dedicated AI tools are getting more and more mature! The fact that we can leverage on our existing models to accelerate the labelling and training process is key to deploy AI faster. Soon, a project of this nature will take just a few minutes to be completed: the time of dragging and dropping the images in Sterblue Cloud platform! ” Geoffrey Vancassel, Sterblue CEO
6. Performance: Assessing the AI against fine tuned KPIs
There are 2 essential key performance indicators (KPIs) when assessing the AI: Recall & Precision. Recall gives the ratio of real-life defects that are successfully spotted by the AI. For example, if among 100 anomalies present on a transmission tower, the AI detects 90 (true positives) and misses 10 (false negatives), recall will be equal to 90%. Considering the criticality of energy infrastructures, recall is the most important metric to retrieve. Failing to identify and fix network problems can have serious consequences.
On the other hand, Precision refers to the relevance of the detections. In other words, among all the detections pointed out by the AI, precision measures which ones are actual defects (true positives) and which ones are not (false positives). Let’s say the AI detects 100 occurrences. If only 70 of these are actual anomalies, then precision will be equal to 70%. Sterblue also makes a big effort to optimize this metric, since we don’t want to overwhelm our users with false alerts. In an optimal scenario, all the detections are relevant (precision=100%) and the AI misses no detection (recall=100%). (Figure 11)

Precision and recall are expressed as a function of 2 other indicators. Intersection Over Union (IOU) threshold takes into account the overlap between a detection and a ground truth (real-life defect) to determine whether a prediction can be defined as true positive or not. The higher is the IOU chosen, the lower precision and recall will be. Whereas the Confidence Score threshold gives the agreed confidence level from where detections start being considered for the evaluation. (Figure 12)

Keeping on the side 10% of the training data set was essential to compute these metrics and therefore tune the model to achieve the best performance during the test phase. The values of recall and precision oscillated between 44% and 83% and 60% and 100% respectively, depending on the type of defect. (Figure 13)

In normal conditions, Sterblue only rolls out into production anomalies that reach at least 80% in both KPIs, unless the customers ask for a different criteria. However, the goal of this challenge was not to implement the solution directly, but instead to demonstrate how scalable artificial intelligence can be in the short-term and give the customer some clear perspectives. Given the small data set, poor image quality and scarce labelling instructions these were actually very positive results.
7. Added Value: Increasing productivity and reliability with AI
To evaluate the productivity gains of artificial intelligence, Sterblue decided to monitor the time our experts spent labelling each picture with and without the support of the AI. This was especially interesting, because in this project the initial data set of 1237 pictures was very similar to the validation data set in terms of image quality and labelling instructions. In reality, that might not always be the case.
- When labelling the training data set, the industry experts reported to have spent on average close to 2 minutes on images where no detections were made by the AI.
- Whereas, when validating the automatic annotations performed by the AI on the 405 pictures of the test data set, the experts spent an average of 36 seconds per image. (Figure 14)

This means a time-saving of 68% when artificial intelligence was used to support the analysis. Try to imagine one person reviewing and labelling thousands of images for several hours. It is natural that his/her level of attention starts to decrease and potential mistakes start to appear. Real efficiency is born when you team up qualified workers with powerful tools. In the longer term, the experts will be able to iterate much faster over new arriving data and consequently inspect at a higher frequency.
The advantages of integrating an AI tool into the inspection workflow extend far beyond the small sample presented in this white paper. If the major TSO decides to move forward with this technology, the productivity of its teams will increase drastically. And, most importantly, the company will be able to better monitor its infrastructure network, ensuring ongoing reliability and security of electricity supply.
8. Prospects: Scaling and integrating AI into the inspection workflow
Once a proof of concept is complete, Sterblue always models the expected performance evolution, assuming the AI will be fed with more inspection data (and more detections) in the future. In this case, ingesting images for an estimated period of 3 months would be enough to reach ideal levels of recall and precision for defect detection. (Figure 15 & 16)


That is actually the only way to achieve better results: data, data and more data! The size of the data set is intrinsically connected with the performance of the model, keeping in mind the importance of consistent image quality and labelling strategy. For that reason, a standardized and traceable inspection method, like flying drones along automatic trajectories, is highly recommended.
Finally, it is equally necessary to understand how artificial intelligence will fit into the organization’s workflow.
- Is the company using an in-house platform for image analysis?
- Will the results of the AI be feeding another management system afterwards?
- Which use cases is the customer looking for? Defect detection? Inventory management? Vegetation management?
These are examples of questions asked by Sterblue during a close assessment with the customer. The goal is to make sure every step of the asset management workflow runs smoothly, including the associated inputs and outputs. Here once again, versatility is key. While for some customers Sterblue provides the central platform for the entire inspection process , for others we simply offer an individual step of the value chain, like our AI tool. (Figure 17)

9. Artificial intelligence at the service of the customer’s needs
In less than a week, Sterblue was able to prepare, train and measure a data set of more than 1,500 images, while demonstrating a time-saving of more than 60% for the customer. This was only possible thanks to our set of customizable tools that are applicable to a large range of use cases and constantly improved by our engineering team. By the end of 2020, we expect to be achieving much more ambitious results in only a few minutes.
To reach production-level performances with AI takes a long, demanding and highly structured journey. Large amounts of good data, high quality labelling and industry expertise, combined with outstanding algorithmic and engineering work, are some of the key ingredients to build a performant model. But in the end, if you can’t adapt to different customer realities and types of electrical infrastructures, there is no scalable application of the solution.
In the growing and fast changing energy market, selling a revolutionary technology is no longer enough to strive. The real value is added when you solve your customers’ needs.